

After a sale, most teams check one thing: did revenue go up? It usually does — you discounted, so you sold more. But higher revenue doesn't mean you made money. Deep discounts, ad spend, shipping and returns can turn a "successful" campaign into a loss. The number that matters is profit, per product. In our research, half of e-commerce teams couldn't say if their last Black Friday was actually profitable. This is how to be in the half that can.
In our survey of 180 European e-commerce companies, only 50% could say for sure whether their last Black Friday made a profit once discounts, ad spend, shipping and returns were counted. The rest had a rough idea, or had only looked at revenue. And 46% are planning a bigger campaign this year anyway.
That's a risky combination: scaling up a campaign you never checked.
If you can't tell which products made money last time, you'll likely repeat the same deep discounts on the same loss-makers, just with more behind them.
Competitive pricing, discount campaigns and insights in one system.
The usual way to judge a campaign is to compare revenue with last year.
If it's up, the sale worked. But revenue is the top line, not the bottom one. When you discount hard, you sell more units, so revenue almost always goes up, even as the profit on each unit shrinks.
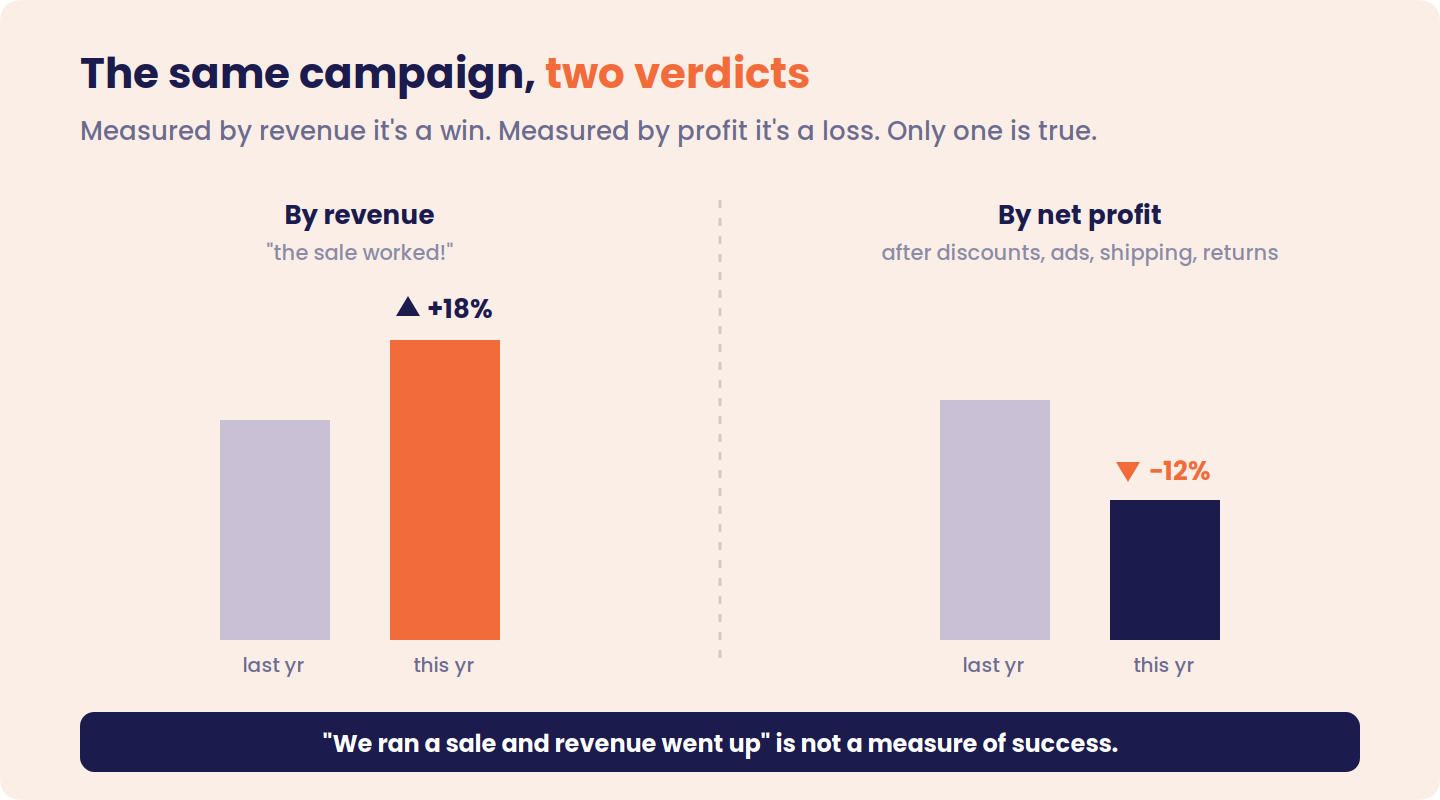
Here's the trap in one picture.
The same campaign looks like a win on revenue and a loss on profit. Most teams stop at the revenue view.
If your review ends the moment revenue beats last year, you don't know whether you made money.
You only know you were busy.
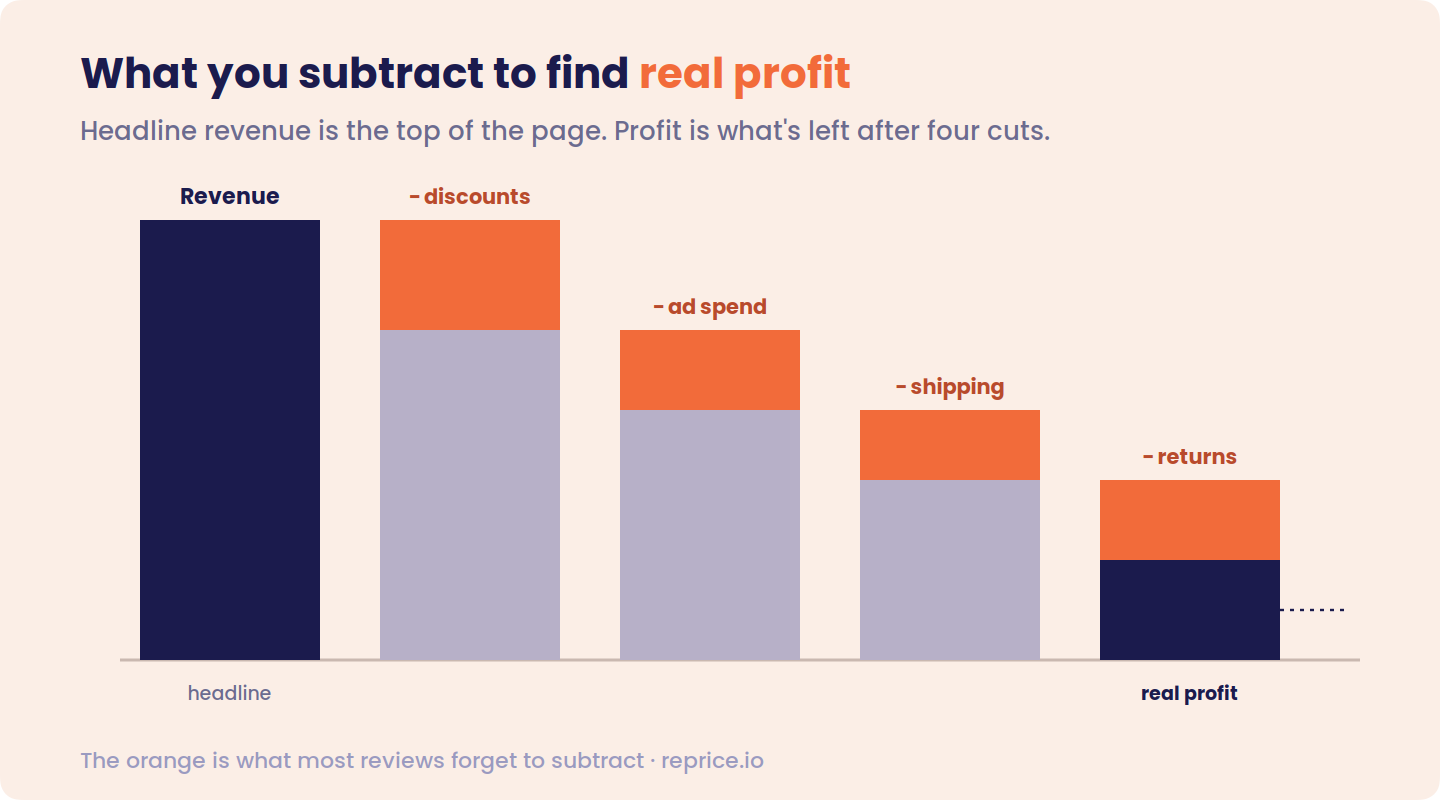
Real profit is what's left after you take out what the campaign actually cost. Four costs matter most, and they're the ones a fast review tends to miss.
First, discounts: the gap between your normal price and what you sold for, on every promoted product.
Second, ad spend: the money that drove the campaign traffic, which can wipe out a discount's profit when the cost per sale rises in peak season.
Third, shipping, especially if you gave free or cheaper delivery to lift conversion.
Fourth, returns, which show up weeks later. A Black Week sale isn't really settled until January, because returned items take their margin back with them.
Leave any of these out and your "profit" isn't real.
One profit number for the whole campaign is better than a revenue number, but it still hides what you need to know. Your best and worst products average out, so next year you repeat both.
What helps next year is seeing each product on its own: which ones sold well at a healthy margin, and which only sold because you cut the price below the point where you made money.
That's the point a margin floor would have stopped you crossing.
You should be able to name your best and worst campaign product.
If you can't, you'll plan the next one blind. This is the same idea as pricing your whole range, not just the headline products: the detail is where the money is.
If this is so useful, why can only half of teams do it?
Because the numbers sit in different places.
Revenue and discounts are in your store, ad spend is in the ad platforms, shipping is in your logistics tool, returns come in later, and cost sits in your ERP.
Pulling all of that into a per-product view by hand, across thousands of products and weeks after the sale, is the kind of job that gets a rough guess instead of a real answer.
It's the same scattered-data problem that makes pricing hard in the first place, back again at the review stage.
You'll always pull ad spend, shipping and returns from your other systems.
But the pricing side, the part that usually takes longest to reconstruct, is where Reprice helps.
Because competitive pricing and campaigns run from the same product data, Reprice already has the pricing numbers per product: revenue, how deep you discounted, margin after cost, and how much stock moved, for each item in the campaign rather than one total.
That gives you the hardest half of the calculation ready to go.
Add your ad spend, shipping and returns on top, and you have a real per-product profit view instead of a guess. It also means you walk into next year's plan knowing which products earned their discount and which didn't, so the next campaign is built on what actually worked.
That's the difference between reviewing a campaign and really measuring it, and it starts with this year's research showing how few teams can.
Competitive pricing, discount campaigns and insights in one system.
Data: The Black Friday Freeze, a survey of 180 European e-commerce companies.